Side-by-side comparison
Pennsylvania State University-Main Campus vs Slippery Rock University of Pennsylvania
Verified federal figures side by side. Bars are drawn from each value so differences read at a glance.
Data verified Nov 2026 · CollegesRef 2026–27 edition
| Metrics | Pennsylvania State University-Main CampusUniversity Park, PA | Add from backpackUp to 2 more | |
|---|---|---|---|
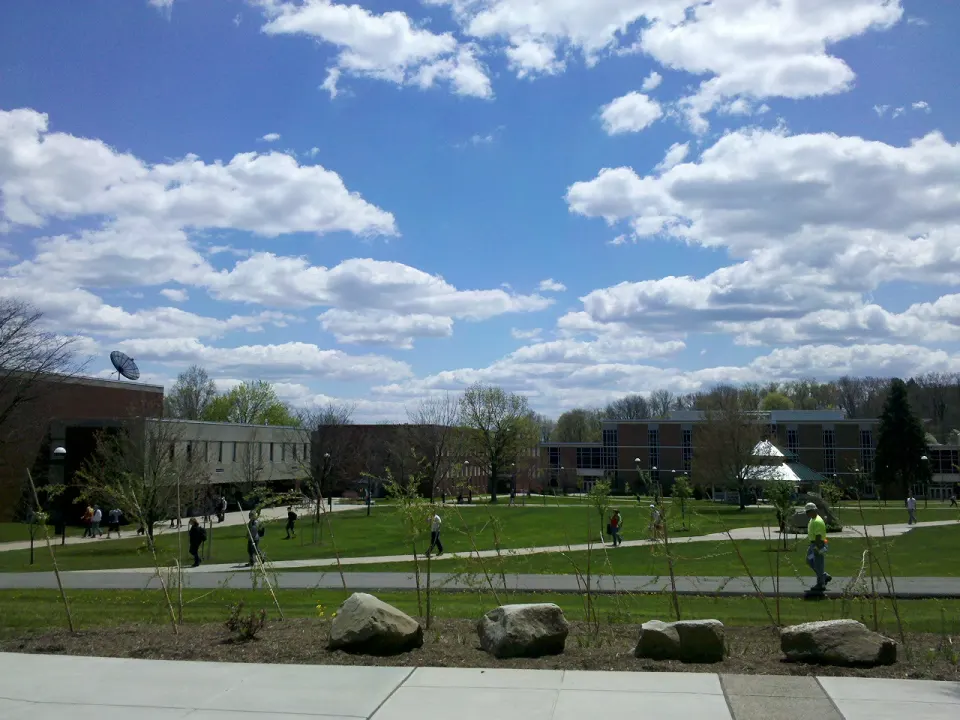
| Location | University Park, PA | Slippery Rock, PA | |
| Control | Public | Public | |
| Carnegie | A Doctoral University (which undergraduates attend) with very high research activity | A College or University that also has a large number of Master’s Degree programs | |
| In-state tuition | $21,098 | $10,906 | |
| Out-of-state tuition | $43,490 | $15,162 | |
| Avg. net price | $33,675 | $19,972 | |
| Acceptance rate | 61% | 71% | |
| Enrollment | 42,284 | 6,788 | |
| Campus setting | City: Small | Town: Distant | |
| Graduation rate | 85% | 68% | |
| Retention rate | 93% | 84% | |
| Median earnings | $71,762 | $57,995 | |
| SAT range | ERW 620-700 · Math 620-720 | ERW 500-610 · Math 480-580 | |
| ACT range | 27-32 | 18-26 | |
| Themes | Not reported | Affordable | |
| View college | View college |
Bars are drawn from the figures in each cell. Rates use a 0–100% scale; tuition, net price, enrollment and earnings are relative to the largest value among the colleges shown (darker bar); SAT and ACT bands sit on each test's full scale (200–800 per SAT section, 1–36 for the ACT).