

To build a college comparison spreadsheet, you must structure your columns around verified federal data points rather than marketing brochures. Start by collecting the unique Office of Postsecondary Education Identification (OPEID) number for each school. Next, populate your rows with standardized metrics from the Integrated Postsecondary Education Data System (IPEDS) and the College Scorecard. This method ensures you compare institutions using identical definitions for costs, aid, and outcomes.
This systematic approach matters most for families who must balance academic fit with strict borrowing limits. The most common misunderstanding is relying on the published "sticker price" instead of the average net price after grants. For example, CollegesRef data shows the median in-state tuition at public colleges is $6,034, while the median tuition at private nonprofit colleges is $48,723. However, the actual net price families pay is often much lower once federal, state, and institutional grants are subtracted. A spreadsheet built on verified net price data prevents families from ruling out schools that appear unaffordable but offer substantial aid.
Key takeaways
- A spreadsheet should track the unique OPEID number and control type to organize institutions by public, private nonprofit, or private for-profit status.
- CollegesRef data shows the median average net price is $10,437 for public colleges compared to $27,167 for private nonprofit institutions.
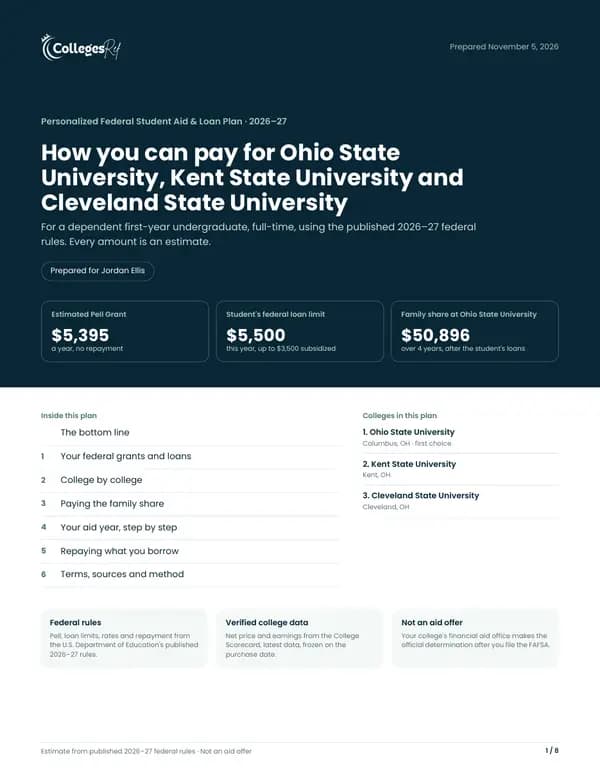
- Dependent undergraduates face strict federal lending limits, capped at $5,500 for the first year and $27,000 over four years according to studentaid.gov.
- CollegesRef data shows the median graduation rate is 44% and the median earnings ten years after entry are $52,768 across all analyzed schools.
- Formulas in your spreadsheet must normalize metrics onto a 0 to 100 scale before applying decimal weights that reflect your family budget.
The Core Architecture of a Verified College Spreadsheet
Why Institutional Control and Carnegie Classification Matter First
A reliable comparison spreadsheet does not begin with average starting salaries or campus amenities. It begins with how a college is funded and structured. Grouping colleges by institutional control (public, private nonprofit, or private for-profit) prevents misleading comparisons.
CollegesRef data shows that the median average net price after grants for private nonprofit colleges is $27,167, compared to $10,437 for public colleges. Mixing these categories without clear labels distorts your financial benchmarks.
The Carnegie Classification of Institutions of Higher Education further refines your list. It separates doctoral research universities from regional master's universities and baccalaureate liberal arts colleges. Comparing a local public university focused on commuter students to a national private research institution is rarely useful. You must establish these categories in your initial columns to ensure you compare similar institutions.
Setting Up Your Column Headers for Apples-to-Apples Comparisons
To build a functional sheet, allocate your first six columns to basic identifiers. Use Column A for the official institution name. Column B must hold the six-digit Office of Postsecondary Education Identifier (OPEID) or the Integrated Postsecondary Education Data System (IPEDS) UnitID. You can find these unique numbers on the federal College Scorecard website.
Column C should record the control type: public, private nonprofit, or private for-profit. Column D is for the Carnegie Classification. Column E should capture the geographic setting, such as city, suburb, town, or rural. Column F must record the undergraduate enrollment size.
Establishing these baseline columns allows you to sort and filter your data systematically. It ensures that when you later calculate average net prices or graduation rates, you can filter out outliers that do not fit your academic or social preferences. For step-by-step instructions on selecting target institutions, consult our comprehensive college guides.
The Danger of Self-Reported Marketing Data Versus Audited Datasets
Colleges frequently publish promotional brochures featuring selective statistics. These marketing materials often highlight "average financial aid packages" that include parent loans, or "placement rates" based on self-reported alumni surveys with low response rates.
To build a spreadsheet that reflects reality, rely strictly on audited federal datasets. The primary source for this information is the IPEDS database, managed by the National Center for Education Statistics.
Before entering any figure into your spreadsheet, verify its source. If a number comes from a university press release rather than the federal IPEDS survey or the institution's Common Data Set (CDS), exclude it. You can download the official CDS PDF directly from any university's institutional research website. Look for Section B for enrollment and graduation data, and Section H for financial aid figures. If a college does not publish its CDS online, email the office of institutional research and request the PDF for the most recent academic year.
Sourcing Reliable Cost and Financial Aid Metrics
Locating Average Net Price in the College Scorecard
Sticker price is a poor metric for a spreadsheet. Most students do not pay the published rate. To find what families actually pay, look up the average net price in the U.S. Department of Education College Scorecard. This figure calculates the total cost of attendance, including tuition, fees, books, and living expenses, minus any federal, state, or institutional grant aid.
CollegesRef data shows that across all 1,408 published U.S. colleges with at least 2,000 students, the median average net price after grants is $13,737. When you build your spreadsheet, create a column for "Average Net Price" next to the published sticker price. You can find this metric broken down by household income quintiles on the College Scorecard website. Input the specific net price that corresponds to your family income bracket to make your cost projections realistic.
Tracking In-State Versus Out-of-State Tuition Discrepancies
For public institutions, residency status dictates your baseline costs. You must create separate columns in your spreadsheet for in-state and out-of-state tuition to avoid costly planning errors.
As shown in the table below, public colleges have a median in-state tuition of $6,034, while the median out-of-state tuition rises to $12,715. This discrepancy disappears at private institutions. For example, private nonprofit colleges have a median in-state tuition of $48,723 and a median out-of-state tuition of $48,702.
If you are looking at an out-of-state public university like The Pennsylvania State University-Main Campus, your spreadsheet must reflect the higher out-of-state rate unless you qualify for a regional tuition reciprocity agreement. Ask the admissions office for a copy of their residency policy document to see if you qualify for in-state rates before finalizing your spreadsheet inputs.
Colleges in this article

The Pennsylvania State University-Main Campus
University Park, PA
- Admit rate
- 92%
- Net price
- $24,012
- Grad rate
- 72%

Arizona State University Campus Immersion
Tempe, AZ
- Admit rate
- 90%
- Net price
- $14,694
- Grad rate
- 67%

Texas A & M University-College Station
College Station, TX
- Admit rate
- 57%
- Net price
- $21,527
- Grad rate
- 85%
Federal IPEDS and College Scorecard data on CollegesRef. Net price is the average paid after grants by first-time, full-time students who receive aid.
Accounting for Pell Grant Recipient Shares as a Socioeconomic Proxy
The percentage of undergraduates receiving federal Pell Grants serves as an excellent proxy for institutional wealth and financial aid generosity. The maximum Federal Pell Grant for the 2026-27 award year is $7,395, according to studentaid.gov. This aid is reserved for students with exceptional financial need.
CollegesRef data shows that the median share of undergraduates receiving Pell Grants across all analyzed institutions is 34%. When a college has a high percentage of Pell recipients but maintains a low average net price, it typically indicates robust institutional need-based aid programs.
Add a column to your spreadsheet for "Pell Grant Share" using data from the Integrated Postsecondary Education Data System (IPEDS). If your family expects to qualify for need-based aid, prioritize colleges where this share is high and the net price remains low. This combination indicates that the financial aid office actively supports lower-income and middle-income families with institutional grants rather than self-help aid like loans and work-study.
| Sector | Colleges | Median net price | Median in-state tuition | Median out-of-state tuition | Median graduation rate | Median earnings (10 yrs) |
|---|---|---|---|---|---|---|
| Public | 1,041 | $10,437 | $6,034 | $12,715 | 38% | $49,461 |
| Private nonprofit | 323 | $27,167 | $48,723 | $48,702 | 70% | $69,656 |
| Private for-profit | 44 | $30,181 | $18,367 | $18,367 | 41% | $47,524 |
Source: CollegesRef analysis of IPEDS and College Scorecard data for 1,408 published U.S. colleges with at least 2,000 students (latest data year 2025). Net price is the average paid by first-time, full-time students who receive grant aid.
At a glance
Graduation rate for the colleges in this list
Integrating Federal Student and Parent Loan Limits
Mapping Dependent Undergraduate Direct Loan Limits by Year
A reliable college comparison spreadsheet must hardcode the actual federal borrowing caps to prevent families from budgeting with non-existent federal student loans. Dependent undergraduate students cannot borrow unlimited amounts under the Federal Direct Loan program. For your spreadsheet, create a dedicated column for "Direct Student Loan Capacity" and input the strict annual limits set by the U.S. Department of Education.
According to studentaid.gov, a dependent undergraduate can borrow a maximum of $5,500 in their first year, $6,500 in their second year, and $7,500 per year for the third year and beyond. The lifetime aggregate limit for these dependent students is $31,000, with a maximum of $23,000 allowed in subsidized loans. Over a standard four-year enrollment, a dependent student can borrow at most $27,000 in their own name.
When you receive a financial aid award letter, locate the line item for "Direct Subsidized Loan" or "Direct Unsubsidized Loan." If the offered amount exceeds these annual thresholds, the financial aid office has made an error, or they have packaged non-federal private loans into your offer.
The Impact of the New Parent PLUS Borrowing Caps
Historically, parents could borrow up to the full cost of attendance minus other aid, which often led to catastrophic debt. Your spreadsheet must reflect the major regulatory changes for loans first disbursed on or after July 1, 2026. According to studentaid.gov, Parent PLUS borrowing is now capped at $20,000 per year and $65,000 in total per dependent student.
To calculate your family's actual funding gap, build a formula in your spreadsheet:
Net Price - Student Direct Loan - Parent PLUS Cap ($20,000) = Remaining Out-of-Pocket Gap
If this formula yields a positive number, you must cover that gap through savings, private loans, or institutional scholarships. For a school like Arizona State University Campus Immersion, where out-of-state costs run higher than in-state tuition, this formula will quickly show whether the institution is financially viable without resorting to high-interest private student loans.
Factoring in Independent Student and Graduate Loan Thresholds
If the applicant meets the federal criteria for an independent student, the spreadsheet formulas must change. Independent undergraduates have access to higher Direct Loan limits because parent borrowing is not an option. According to studentaid.gov, independent students can borrow up to $9,500 in their first year, $10,500 in their second year, and $12,500 annually in their third year and beyond, up to an aggregate limit of $57,500.
For families planning for graduate school, the rules are even tighter. For new borrowers starting July 1, 2026, Grad PLUS loans are eliminated entirely. Graduate students are limited to borrowing up to $20,500 per year in Direct Unsubsidized Loans with a lifetime aggregate limit of $100,000. Professional students, such as medical or law students, may borrow up to $50,000 annually with a lifetime limit of $200,000. Hardcoding these limits prevents families from assuming that federal graduate school funding will cover unlimited tuition charges.
Evaluating Institutional Outcomes and Student Success
Why the Six-Year Graduation Rate is the Industry Standard
A four-year graduation rate no longer reflects the typical path for most undergraduates. The Integrated Postsecondary Education Data System (IPEDS) tracks the percentage of first-time, full-time students who complete their degrees within six years, a standard window that accounts for students who change majors, transfer, or work while enrolled. When building a spreadsheet, use this six-year metric to avoid penalizing schools with large co-op programs or high numbers of working students.
According to CollegesRef data, the median graduation rate across all 1,408 published U.S. colleges with at least 2,000 students is 44 percent. However, outcomes vary dramatically by institutional control. Private nonprofit colleges hold a median graduation rate of 70 percent, while public colleges sit at 38 percent, and private for-profit institutions drop to 41 percent.
For a clear comparison, look at the graduation rates of some of the largest institutions in the country. CollegesRef data shows that Texas A & M University-College Station achieves an 85 percent graduation rate, and The Pennsylvania State University-Main Campus reaches 72 percent. In contrast, Arizona State University Campus Immersion has a 67 percent graduation rate, Grand Canyon University stands at 54 percent, Southern New Hampshire University is at 42 percent, and University of Phoenix-Arizona reports 21 percent. Add a column to a spreadsheet for this six-year rate to identify colleges where students frequently struggle to finish.
Measuring Post-Graduation Earnings Ten Years After Entry
To measure the financial return on investment, a spreadsheet should include the median earnings of students ten years after they first enrolled. This metric, sourced from the federal College Scorecard, captures tax data for federal financial aid recipients a decade after they started college, meaning it accounts for dropouts as well as graduates.
CollegesRef data shows the median earnings ten years after entry across all analyzed institutions is $52,768. Private nonprofit colleges lead with median earnings of $69,656, followed by public colleges at $49,461, and private for-profit colleges at $47,524.
To make this actionable, calculate a simple debt-to-earnings ratio in a spreadsheet. Divide the total estimated student loan debt upon graduation by the ten-year median earnings figure. If the resulting ratio is greater than 1.0, the student will likely struggle to manage monthly payments under standard ten-year repayment plans.
Balancing Selectivity and Acceptance Rates Against Outcome Metrics
Families often mistake low acceptance rates for high educational quality. Across the 1,408 colleges on CollegesRef with at least 2,000 students, the median acceptance rate is 78 percent.
When configuring a spreadsheet, do not assign positive weights to low acceptance rates. Instead, use the acceptance rate as a context filter. Compare a school's selectivity directly against its graduation rate and median earnings. If a college accepts a tiny fraction of applicants but has a graduation rate or median earnings profile similar to a public university with an 80 percent acceptance rate, the highly selective school may not be delivering a superior economic return. Families can verify these trends by requesting the institutional Common Data Set from each admissions office and checking Section C to see exactly how GPA and test scores correlate with admission decisions.
How to Normalize and Weight Your Spreadsheet Scores
Creating a Simple Weighted Scoring Formula in Excel or Sheets
To compare schools with vastly different metrics, you must convert raw data into a standardized scale from 0 to 100. This process, called normalization, prevents a high-dollar tuition figure from distorting a low percentage-based graduation rate.
For positive metrics where higher is better, such as the graduation rate, use this formula in your spreadsheet cell:
=((Value - Min) / (Max - Min)) * 100
For negative metrics where lower is better, such as net price, invert the formula:
=((Max - Value) / (Max - Min)) * 100
In these formulas, "Max" and "Min" represent the highest and lowest values within your specific list of target colleges. If you are comparing Purdue University-Main Campus against other public institutions, your maximum graduation rate might be the 85% rate seen at Texas A & M University-College Station and your minimum the 38% median rate for public colleges.
Once normalized, assign a decimal weight to each category. The sum of all weights must equal 1.0. Create a final score column using the SUMPRODUCT function to multiply each normalized score by its assigned weight.
Adjusting Weights Based on Family Financial Constraints
A family must align spreadsheet weights with their actual budget limitations. If the student expects to rely entirely on federal student aid, the average net price must carry the heaviest weight in the model.
According to studentaid.gov, a dependent undergraduate faces strict federal lending limits, such as $5,500 for the first year and a maximum of $27,000 over four years (https://studentaid.gov/understand-aid/types/loans/subsidized-unsubsidized). If the family cannot pay the remaining balance out of pocket, any college with a net price exceeding these limits plus available grants should be penalized in the spreadsheet. You can achieve this by assigning a 50% weight (0.50) to the normalized net price category and restricting the graduation rate weight to 20% (0.20).
Conversely, if a family has fully funded a 529 college savings plan, the net price weight can be lowered to 15% (0.15). This adjustment allows outcomes, such as the ten-year post-entry earnings, to dominate the final ranking formula.
Avoiding the Pitfalls of Arbitrary Qualitative Rankings
Do not insert subjective scores like "campus beauty" or "sports culture" directly into your primary data columns. These arbitrary inputs degrade the integrity of audited federal data.
If you want to include qualitative factors, restrict them to a separate multiplier column. Rate these subjective elements on a strict scale of 0.8 to 1.2. Multiply your final calculated quantitative score by this factor to adjust the ranking without corrupting the core financial and academic data.
Before finalizing your spreadsheet rankings, email the financial aid office at each target school to ask for their specific historical tuition inflation rate. Use this percentage to project actual costs for years two, three, and four, rather than assuming the freshman-year net price will remain constant. This step ensures your spreadsheet calculations reflect the actual total cost of attendance.
Moving Beyond the Spreadsheet to the Financial Aid Offer
Comparing the Spreadsheet Net Price to Your Actual Award Letter
The average net price in your spreadsheet is a historical, population-level baseline. When the actual financial aid award letter arrives from the financial aid office, you must replace that baseline with your personalized figures. Locate the "Estimated Cost of Attendance" on the offer. This figure must include tuition, fees, housing, food, books, and personal expenses.
Subtract only your "gift aid," which includes institutional grants, state grants, and federal grants like the Federal Pell Grant. According to studentaid.gov, the maximum Federal Pell Grant for the 2026-27 award year is $7,395 (https://studentaid.gov/understand-aid/types/grants/pell). The resulting number is your true net price. Compare this actual figure against the CollegesRef median average net price for that sector. For example, CollegesRef data shows a median average net price of $10,437 for public colleges and $27,167 for private nonprofit colleges. If your personalized net price at a school like Indiana University-Bloomington Main Campus is significantly higher than the sector median, you must identify which specific costs are driving the variance.
Identifying Unsubsidized Loans Disguised as Financial Aid
Colleges often list federal student loans inside the "Award" section of the financial aid letter to make the net cost look lower. You must categorize these loans as debt, not aid. Look for "Direct Unsubsidized Loan" or "Direct Subsidized Loan" on the offer.
For a dependent first-year undergraduate, the federal limit for these loans is strictly capped at $5,500, as documented by studentaid.gov (https://studentaid.gov/understand-aid/types/loans/subsidized-unsubsidized). If the college includes a Parent PLUS Loan to cover the remaining gap, check the amount carefully. For loans first disbursed on or after July 1, 2026, Parent PLUS borrowing is capped at $20,000 per year (https://studentaid.gov/understand-aid/types/loans/plus/parent). Any award letter that lists a Parent PLUS Loan exceeding $20,000, or lists it as a generic "award" to bring your net cost to zero, is violating federal limits or misrepresenting your actual out-of-pocket obligation. Deduct all loan options from the aid total on your spreadsheet to find the actual cash gap your family must fund.
Using Your Verified Data Spreadsheet for Financial Aid Appeals
Your completed spreadsheet serves as an objective tool during a financial aid appeal. Do not contact the financial aid office with emotional pleas. Instead, request a "Special Circumstances Review" or a "Financial Aid Appeal Form" directly from the office website.
Use the verified metrics in your spreadsheet to show the aid officer how their offer compares to peer institutions with similar Carnegie classifications. If a competing private nonprofit college with a similar graduation rate offered a lower net price, present that specific award letter as documentation. Point to the median earnings or graduation rates from your spreadsheet to demonstrate that you are evaluating the enrollment decision as a long-term financial investment. State the exact dollar amount of additional institutional grant aid needed to make the college competitive with your other verified options.
Three Real-World Spreadsheet Scenarios for Different Family Profiles
A first-generation student comparing two in-state offers
This scenario uses hypothetical household figures to demonstrate how a student compares local public options. The applicant lives in-state and qualifies for the maximum Federal Pell Grant of $7,395, as documented on https://studentaid.gov/understand-aid/types/grants/pell. The student compares two public institutions using CollegesRef data: a large research university with a median graduation rate of 38% for public colleges, and a local state college.
First, the student builds a spreadsheet row for each school. They enter the published in-state tuition. CollegesRef data shows the median in-state tuition for public colleges is $6,034. They subtract the $7,395 Pell Grant, which leaves a surplus of $1,361 for books and fees at the median public college. Second, they look at the median average net price after grants for all public colleges, which is $10,437. This net price includes living expenses. The student adds a column for the first-year federal student loan limit of $5,500, sourced from https://studentaid.gov/understand-aid/types/loans/subsidized-unsubsidized.
Third, they calculate the remaining out-of-pocket gap. For the median public college, the gap is $4,937 after subtracting the federal loan from the net price. The student decides to choose the local state college because they can commute from home. This choice eliminates the room and board portion of the net price, allowing them to graduate with less than the $27,000 maximum four-year dependent student loan limit.
A middle-income family weighing public versus private nonprofit options
This scenario uses hypothetical household figures to analyze the choice between a public university and a private nonprofit college. The family has an expected parent contribution of $15,000 per year. They compare Arizona State University Campus Immersion against a median private nonprofit college.
First, they input the graduation rates into their spreadsheet. The chart on CollegesRef shows Arizona State University Campus Immersion has a 67% graduation rate, while CollegesRef data shows private nonprofit colleges have a median graduation rate of 70%. Second, they list the costs. The median out-of-state tuition for a public college is $12,715, while the median out-of-state tuition for a private nonprofit is $48,702. Third, they look at the median average net price after grants. For private nonprofits, this net price is $27,167. For public colleges, it is $10,437.
Fourth, they calculate the borrowing needs. The student takes the maximum first-year Direct Loan of $5,500. The parents must borrow the remaining $6,667 using Parent PLUS loans. This fits under the Parent PLUS cap of $20,000 per year set by https://studentaid.gov/understand-aid/types/loans/plus/parent. However, the family decides on the public option because the median net price of $10,437 is fully covered by their $15,000 budget, leaving them with zero debt.
An independent adult student returning to complete a degree
This scenario uses hypothetical household figures to plan a return to college for an independent student. The student wants to compare a private for-profit college with a public university.
First, the student creates spreadsheet columns for independent student loan limits. According to https://studentaid.gov/understand-aid/types/loans/subsidized-unsubsidized, independent undergraduates can borrow up to $9,500 in their first year. Second, they enter the median average net price for both sectors. CollegesRef data shows the median net price for private for-profit colleges is $30,181, while the median net price for public colleges is $10,437. Third, they compare the median earnings 10 years after entry. For-profit colleges show median earnings of $47,524, compared to $49,461 for public colleges.
Fourth, they calculate the funding gap. The for-profit net price of $30,181 minus the $9,500 independent loan leaves a gap of $20,681 per year. The public college net price of $10,437 minus the $9,500 loan leaves a gap of $937. The student chooses the public university because the low annual gap prevents them from exhausting their $57,500 lifetime independent borrowing limit before graduation.