

A student should borrow no more for an undergraduate degree than their expected starting salary after graduation. This guideline translates to keeping total student loan debt below 100% of first-year earnings, though keeping debt below 50% of starting pay provides a much safer financial cushion.
This benchmark matters most for families planning to borrow beyond federal student loan limits, which often requires turning to high-interest private loans or parent loans. A common misunderstanding is that colleges limit how much a family can borrow based on what the student will realistically earn. In reality, the financial aid office calculates the cost of attendance and permits families to borrow up to that full amount, regardless of whether the student's future field of study pays $35,000 or $100,000.
Key takeaways
- A student should borrow no more for an undergraduate degree than their expected starting salary after graduation to keep payments around ten percent of gross income.
- Federal data shows that graduates' median federal loan debt equals thirty-six percent of former students' median annual earnings ten years after enrolling.
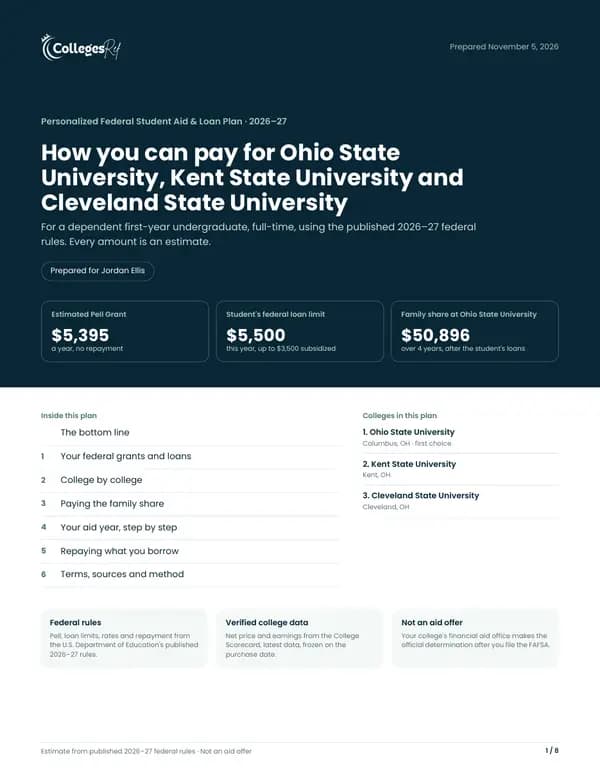
- Dependent undergraduate students face a strict federal lifetime borrowing limit of thirty-one thousand dollars, with at most twenty-seven thousand dollars over four years.
- Private nonprofit colleges show a seventy percent median graduation rate and median earnings of sixty-nine thousand six hundred forty-two dollars ten years after entry.
- For loans disbursed on or after July 1, 2026, Parent PLUS borrowing is capped at twenty thousand dollars per year and sixty-five thousand dollars total.
The Golden Rule of Student Borrowing: Matching Debt to Your Future Salary
Why Your First-Year Salary Is the Ultimate Borrowing Cap
A student should never graduate with more total student loan debt than their expected starting annual salary. This rule of thumb keeps monthly loan payments manageable within a standard post-graduation budget. To apply this rule, an applicant must research realistic entry-level wages for their intended field rather than relying on broad national averages. A student can request a graduate outcomes report directly from a university's career services office or look up specific occupational codes on the U.S. Bureau of Labor Statistics website. If a chosen career path offers a starting salary of $45,000, then $45,000 is the absolute ceiling for all undergraduate borrowing across four years. This cap represents the combined total of all federal Direct Loans, private loans, and parent loans taken out on the student's behalf.
How the Student Loan Debt to Income Ratio Affects Your Monthly Budget
When student debt matches or stays below the first-year salary, the monthly loan payment generally consumes about 10% of the graduate's gross monthly income. This calculation assumes a standard 10-year federal repayment plan. If a graduate earns a starting salary of $50,000, a manageable monthly payment sits at approximately one-tenth of their monthly gross income. Exceeding this 10% threshold forces major trade-offs in a graduate's daily life. It reduces the money available for rent, health insurance, transportation, and emergency savings.
To see how different debt levels translate into actual monthly bills, families can use the CollegesRef Student Loan Repayment Estimator. This tool estimates monthly payments for federal student loans under standard repayment plans but does not predict future interest rate changes or guarantee specific terms.
For families facing high costs, finding institutions with generous financial aid packages can prevent budget strain. Some students may qualify for zero-loan financial aid packages at Colleges Where Low-Income Families Pay Under $5,000 a Year After Grants, which significantly lowers the required borrowing.
The Danger of Exceeding a 1-to-1 Debt-to-Salary Ratio
Borrowing more than a 1-to-1 ratio of debt to starting salary creates a high risk of financial distress. If a student borrows $70,000 to enter a profession that pays $45,000 annually, the monthly payments will demand 15% to 20% of their gross pay. After federal, state, and local taxes are withheld from a paycheck, that loan payment can easily consume more than a quarter of the graduate's take-home pay. This imbalance often forces graduates to extend their repayment terms to 20 or 25 years. While extending the term lowers the monthly payment, it dramatically increases the total interest paid over the life of the loan. A student can calculate their potential debt-to-salary ratio by dividing their projected total borrowing by their target profession's median starting salary. Any result higher than 1.0 indicates that the student is taking on too much debt for that specific academic program.
What Federal Data Reveals About the National Student Debt vs Salary Benchmark
The 36% National Median: Debt-to-Earnings Across Four-Year Colleges
Federal records show how much undergraduate debt students accumulate compared to what they actually earn after leaving campus. According to the graduate debt vs earnings by state analysis from CollegesRef, the median federal loan debt for graduates across 1,349 four-year public and private nonprofit colleges equals 36% of former students' median annual earnings ten years after enrolling. In absolute terms, this represents a median debt of $21,500 against median earnings of $59,860.
A student can use these benchmarks to evaluate their own financial aid offer. When you receive a financial aid award letter, locate the federal direct loan offer on the line items. Multiply that annual loan amount by four to estimate your total undergraduate debt, then compare it to the median earnings for that specific college on the College Scorecard. If your projected total debt exceeds 36% of those median earnings, you are borrowing above the national benchmark.
Why Public and Private Nonprofit Colleges Diverge on Debt Ratios
The relationship between student debt and subsequent earnings varies significantly by institutional sector. CollegesRef data shows that the median debt-to-earnings ratio is 33% at public colleges, whereas it rises to 38% at private nonprofit colleges.
This divergence is driven by the underlying costs and outcomes of each sector, as shown in the table below. Public institutions offer a lower median in-state tuition of $6,089, which helps keep overall borrowing lower despite a median 10-year earnings figure of $49,519. Conversely, private nonprofit institutions carry a much higher median in-state tuition of $48,600. While these private colleges yield higher median earnings of $69,642 and a stronger median graduation rate of 70%, the larger initial price tag forces students to take on larger loans.
Families must look beyond the sticker price to the actual net price. To understand how these costs scale based on household resources, families can learn How to Read a College's Net Price by Family Income to estimate their actual out-of-pocket exposure before signing a master promissory note. For example, a student looking at The Pennsylvania State University-Main Campus will see an average net price of $24,012, which requires more borrowing than the typical public college median.
Colleges in this article
University of Phoenix-Arizona
Phoenix, AZ
- Admit rate
- —not reported
- Net price
- $13,916
- Grad rate
- 21%

Arizona State University Campus Immersion
Tempe, AZ
- Admit rate
- 90%
- Net price
- $14,694
- Grad rate
- 67%
Federal IPEDS and College Scorecard data on CollegesRef. Net price is the average paid after grants by first-time, full-time students who receive aid.
The High-Debt Outliers: Where Debt Reaches Half of Annual Earnings
At many institutions, the balance between debt and earnings is heavily skewed. At 106 colleges, representing 8% of the analyzed four-year institutions, the median graduate debt reaches or exceeds 50% of a graduate's median annual earnings ten years after enrollment.
Geographic location also influences these ratios due to regional tuition rates and local labor markets. Borrowing is heaviest relative to pay in Alabama, where the median debt is 49% of earnings across 23 colleges. By contrast, borrowing is lightest in California, where median debt is 23% of earnings across 75 colleges.
Before committing to a high-debt school, ask the financial aid office for their graduates' cohort default rate and the median debt of program completers. If the median debt at graduation is more than half of the projected starting salary, the monthly loan payments will severely restrict the graduate's budget.
| Sector | Colleges | Median net price | Median in-state tuition | Median out-of-state tuition | Median graduation rate | Median earnings (10 yrs) |
|---|---|---|---|---|---|---|
| Public | 1,055 | $10,517 | $6,089 | $12,675 | 42% | $49,519 |
| Private nonprofit | 326 | $27,122 | $48,600 | $48,600 | 70% | $69,642 |
| Private for-profit | 62 | $27,612 | $17,370 | $17,370 | 42% | $45,510 |
Source: CollegesRef analysis of IPEDS and College Scorecard data for 1,443 published U.S. colleges with at least 2,000 students (latest data year 2025). Net price is the average paid by first-time, full-time students who receive grant aid.
At a glance
Average net price for the colleges in this list
- Western Governors University
- $12,748
- Grand Canyon University
- $21,509
How State-Level Realities and Institutional Sectors Change the Debt Equation
The Geographic Spread: From California's Lows to Alabama's Highs
Geographic location heavily influences how much debt a student accumulates relative to their post-college earnings. According to state-level data published on collegesref.com, borrowing is heaviest relative to pay in Alabama. Across 23 colleges in that state, the median graduate debt reaches 49% of median annual earnings. Conversely, borrowing is lightest in California, where median debt is just 23% of earnings across 75 colleges.
This regional disparity often stems from differences in state funding for higher education, local living costs, and state-specific financial aid programs. When evaluating out-of-state options, families must calculate if the potential salary premium of a specific region justifies the higher debt ratio. An applicant can request a financial aid award letter comparison worksheet from the college admissions office to map these regional cost differences directly against local salary projections.
Comparing Graduation Rates and Net Prices Across Sectors
The type of institution a student attends plays a massive role in both the net price paid and the likelihood of finishing the degree. CollegesRef 2026–27 edition data, sourced from the official College Scorecard, reveals stark differences between public and private nonprofit sectors.
For the 1,055 public colleges analyzed, the median average net price after grants is $10,517, with a median in-state tuition of $6,089 and out-of-state tuition of $12,675. However, the median graduation rate at these public institutions sits at 42%, and the median earnings ten years after entry are $49,519.
In contrast, the 326 private nonprofit colleges show a much higher median graduation rate of 70%. This higher completion rate comes with a steeper price tag. The median average net price for private nonprofits is $27,122, with median tuition reaching $48,600. Ten years after enrolling, former students from these private nonprofit institutions see median earnings of $69,642.
Families must weigh the lower initial cost of public universities against the higher graduation probability and higher median earnings associated with private nonprofits. To estimate how these sector costs translate into monthly liabilities, students can review the federal student loan limits to see how much of the net price can be covered by federal borrowing.
How For-Profit Colleges Compare on Costs and Ten-Year Earnings
The financial equation shifts dramatically when looking at the private for-profit sector. CollegesRef 2026–27 edition data for 62 private for-profit colleges shows a median average net price of $27,612, which is comparable to private nonprofits. The median tuition at these institutions is $17,370.
Despite costs that rival nonprofit institutions, the outcomes differ significantly. The median graduation rate at these for-profit colleges is 42%, matching the public sector but lagging far behind nonprofits. More critically, the median earnings ten years after entry are $45,510, the lowest of any institutional sector.
Before enrolling in a for-profit program, students should compare these outcomes to local public alternatives or specialized state programs, such as learning How to Use New York Workforce Pell Grants for Job Training to bypass high-debt degrees entirely.
Federal Borrowing Limits: What You Are Actually Allowed to Borrow
The federal government sets strict caps on how much a student can borrow each year. These limits depend on dependency status, year in school, and degree level. When you review your financial aid award letter, the amount listed under Federal Direct Loans cannot exceed these statutory maximums.
Direct Loan Annual and Aggregate Limits for Dependent Undergraduates
For dependent undergraduate students, the William D. Ford Federal Direct Loan Program limits borrowing by academic year. According to studentaid.gov, first-year dependent students can borrow a maximum of $5,500. This limit rises to $6,500 in the second year, and $7,500 in the third year and beyond. Over a standard four-year degree, a dependent student can borrow a maximum of $27,000.
The absolute lifetime aggregate limit for dependent undergraduates is $31,000. No more than $23,000 of this total may be in subsidized loans. Subsidized loans do not accrue interest while you are enrolled at least half-time. Unsubsidized loans begin accruing interest immediately upon disbursement. To find out which portion of your offer is subsidized, check the "Subsidized" line item on your college financial aid offer or log into your studentaid.gov dashboard. You can also review the current federal loan interest rates to calculate how much interest will accumulate on the unsubsidized portion before graduation.
Borrowing Rules and Higher Limits for Independent Undergraduates
Students classified as independent for federal financial aid purposes have access to higher borrowing limits. This status is determined by the Free Application for Federal Student Aid (FAFSA) based on age, marital status, veteran status, or ward-of-the-court status. Independent undergraduates can borrow up to $9,500 in their first year, with a limit of $10,500 in the second year. For the third year and beyond, the annual limit is $12,500.
The lifetime aggregate limit for independent undergraduate students is $57,500. This higher limit helps non-traditional students cover educational costs without relying on parental credit. If a dependent student's parents are denied a Parent PLUS loan due to adverse credit history, the student may become eligible for these higher independent borrowing limits. If you find yourself in this situation, ask your financial aid office for a "PLUS Denial Unsubsidized Loan Request" form to secure the additional funding.
The New Caps on Parent PLUS and Graduate Direct Unsubsidized Loans
Significant structural changes apply to federal borrowing for parents and graduate students. For loans first disbursed on or after July 1, 2026, Parent PLUS borrowing is capped at $20,000 per year and $65,000 in total per dependent student, according to studentaid.gov. Previously, parents could borrow up to the full cost of attendance minus other aid. This change forces families to look closely at net costs. If the net price exceeds federal limits, families must find other funding sources or look for options like the Most Affordable Private Colleges by Net Price (2026).
Furthermore, for new borrowers starting July 1, 2026, Grad PLUS loans are discontinued. Graduate students may now borrow up to $20,500 annually in Direct Unsubsidized Loans, with a lifetime aggregate limit of $100,000. Professional students, such as medical or law students, have an annual limit of $50,000 and a lifetime aggregate limit of $200,000.
How to Calculate Your Personal Safe Borrowing Limit
Step 1: Find the Median Debt and Earnings for Your Target College
A family must first gather real institutional data rather than relying on national averages. Go to the official College Scorecard website at https://collegescorecard.ed.gov/ and search for the specific institution. Under the "Financial Aid and Debt" section, locate the median federal debt of graduates. Next, scroll to the "Earnings After School" section to find the median salary of former students ten years after they first enrolled.
Write these two numbers down on a worksheet. Divide the median debt by the median earnings to find the institutional debt-to-earnings ratio. For example, if a college shows a median graduate debt of $20,000 and median ten-year earnings of $50,000, the ratio is 40%. If this ratio exceeds the national median of 36% found in the CollegesRef 2026–27 edition, the student may face a heavier repayment burden than the average borrower.
Step 2: Estimate Your Monthly Payments Under Standard Repayment Plans
Once you have the total projected debt, you must translate that lump sum into a monthly bill. Use the CollegesRef Student Loan Repayment Estimator to calculate your estimated monthly payments under standard ten-year federal repayment plans.
Suppose a dependent undergraduate plans to borrow the maximum allowable federal limit of $27,000 over four years, as detailed on https://studentaid.gov/understand-aid/types/loans/subsidized-unsubsidized. Entering $27,000 into the estimator tool reveals the monthly commitment after graduation. Compare this monthly payment against a realistic entry-level budget. Financial planners recommend keeping student loan payments under 10% of a graduate's gross monthly income. If the estimated monthly payment from the tool exceeds 10% of the monthly equivalent of the Scorecard median salary, the planned borrowing level is too high.
Step 3: Adjust Your Borrowing Target Based on Your Expected Major
Median institutional earnings reflect all graduates, combining high-paying engineering degrees with lower-paying humanities degrees. To refine your borrowing limit, you must look at major-specific data.
Review the CollegesRef database of earnings against debt by major to see how your chosen field of study performs. A student majoring in computer science can safely carry a higher debt load than a student majoring in social work because of the difference in starting salaries. If the major-specific data indicates a starting salary of $40,000, the total student loan debt should not exceed $40,000.
If the calculations show a funding gap, families should ask the financial aid office for a "Financial Aid Shopping Sheet" or "College Financing Plan" to identify additional institutional grants. When out-of-state costs stretch the budget too far, families can compare alternative options using the list of Public Universities With the Lowest Out-of-State Tuition (2026) to find institutions that align with their safe borrowing threshold.
Strategies to Bridge the Funding Gap Without Over-Borrowing
Maximizing Federal Pell Grants and Institutional Aid
When the net price of a college exceeds safe borrowing limits, families must target aid that does not require repayment. A student should start by submitting the Free Application for Federal Student Aid (FAFSA) as early as possible to secure federal grants. According to studentaid.gov, the maximum Federal Pell Grant for the 2026-27 award year is $7,395. This federal safety net is reserved for undergraduate students with exceptional financial need.
Beyond federal funds, institutional aid offers the largest potential cost reduction. Families should compare the sticker price of a school against its actual net cost. You can use a college cost calculator: net price vs sticker price to estimate what families with similar income profiles actually paid at a specific campus after accounting for grants and scholarships.
If the financial aid package still leaves a significant gap, a student can appeal the award letter. To do this, email the financial aid office to request a professional judgment review. The family must provide documentation of changed financial circumstances, such as a job loss, high medical bills, or a sibling's private school tuition.
The Role of Work-Study and Part-Time Employment
Federal Work-Study programs provide part-time jobs for undergraduate and graduate students with financial need. The FAFSA includes a specific checkbox asking if a student wants to be considered for work-study. If selected, the student receives an award allocation on their financial aid letter, which represents the maximum amount they can earn through an on-campus or approved off-campus job.
Unlike regular employment, work-study earnings are excluded from the student's adjusted gross income when calculating the Student Aid Index on the following year's FAFSA. This exclusion prevents part-time earnings from reducing future financial aid eligibility.
For students who do not qualify for work-study, campus dining services, libraries, and academic departments often hire student workers directly. Working 10 to 15 hours per week at the state minimum wage can generate several thousand dollars per year to cover personal expenses and textbooks, directly reducing the need for unsubsidized loans.
When to Consider Lower-Cost Pathways Like Community College Transfer
Completing general education requirements at a local community college before transferring to a four-year institution is a highly effective way to limit undergraduate debt. This pathway allows a student to live at home, eliminating room and board costs that often make up half of a college budget.
Before enrolling, a student must obtain a written articulation agreement from the target four-year university. This document lists the exact community college course codes that satisfy specific major requirements.
Families can research institutional policies and transfer pathways through our Financial Aid resources to find schools with generous transfer credit policies. By spending two years at a community college and two years at a public university, a student can graduate with a bachelor's degree from the four-year institution while cutting their total borrowing needs roughly in half.
Three Real-World Borrowing Scenarios: Safe vs. High-Risk Student Debt
A first-generation student comparing two in-state offers
This scenario uses hypothetical household figures to evaluate two real options. A student from Arizona is deciding between the University of Phoenix-Arizona and Arizona State University Campus Immersion. The family has no college savings and qualifies for the maximum Federal Pell Grant of $7,395, as detailed on https://studentaid.gov/understand-aid/types/grants/pell.
First, the student looks up the average net price for each school in the CollegesRef 2026–27 edition. The University of Phoenix-Arizona has an average net price of $13,916, while Arizona State University Campus Immersion has an average net price of $14,694.
Second, the student subtracts the Pell Grant from the net price to find the remaining annual funding gap. For the University of Phoenix-Arizona, the annual gap is $6,521. For Arizona State University, the annual gap is $7,299.
Third, the student calculates the total debt over four years. Both totals fall under the federal aggregate limit of $31,000 for dependent undergraduates, which is documented at https://studentaid.gov/understand-aid/types/loans/subsidized-unsubsidized.
Fourth, the student compares these totals to the median earnings for each sector. CollegesRef data from College Scorecard shows that the median earnings ten years after entry are $45,510 for private for-profit colleges and $49,519 for public colleges.
The student decides to enroll at Arizona State University. The debt-to-earnings ratio for Arizona State University is 59%, which is safer than the 57% ratio at the for-profit option when paired with the higher long-term salary potential of the public sector.
A dependent student choosing between public and private nonprofit options
This scenario uses hypothetical household figures to compare a public university with a private nonprofit college. An applicant is admitted to The Pennsylvania State University-Main Campus and a private nonprofit college. The family can contribute $10,000 annually from savings.
First, the applicant identifies the average net price for each school. The CollegesRef 2026–27 edition lists the average net price for Penn State at $24,012. CollegesRef data shows the median average net price for private nonprofit colleges is $27,122.
Second, the applicant subtracts the family contribution of $10,000 from each net price.
Third, the applicant calculates the four-year borrowing requirement.
Fourth, the applicant checks the federal borrowing limits. A dependent undergraduate can only borrow a maximum of $27,000 over four years. The remaining balance must be covered by Parent PLUS loans.
The family decides to choose Penn State. The private nonprofit option requires the parents to borrow near the federal Parent PLUS limit of $65,000, which is established at https://studentaid.gov/understand-aid/types/loans/plus/parent. Choosing Penn State keeps the parent debt lower and aligns better with the median earnings of $49,519 for public college graduates.
An independent student evaluating a high-cost online program
This scenario uses hypothetical household figures to assess an online degree program. An independent student is considering Southern New Hampshire University while working part-time. The student has no parental financial support.
First, the student finds the average net price of $36,764 in the CollegesRef 2026–27 edition.
Second, the student subtracts their part-time earnings contribution of $8,000 per year.
Fourth, the student compares this to the federal limits. According to https://studentaid.gov/understand-aid/types/loans/subsidized-unsubsidized, the aggregate limit for independent undergraduates is $57,500.
The student decides not to enroll. The required debt is double the federal limit and exceeds the median earnings of $69,642 for private nonprofit graduates. This scenario presents an extreme financial risk.
You can input your own financial aid offers and compare prospective salaries using the CollegesRef Student Loan Repayment Estimator.