

Families can evaluate and compare colleges by using the Integrated Postsecondary Education Data System to find verified, standardized metrics on actual costs, graduation rates, and post-college earnings. This federal database bypasses promotional marketing by forcing institutions to report uniform figures to the National Center for Education Statistics. Comparing these objective data points allows applicants to identify which schools offer the strongest financial return.
This analysis matters most for families trying to calculate their actual out-of-pocket costs and long-term debt. A common misunderstanding is relying on the published sticker price, which rarely reflects what a student actually pays. By looking at the average net price after grants in the federal database, families can see the real cost. For example, CollegesRef data shows a median average net price of $13,737 across 1,408 published U.S. colleges with at least 2,000 students, a figure far below the advertised tuition of most private institutions.
Key takeaways
- The median average net price across 1,408 analyzed colleges is $13,737, which is far below the published sticker price of most private institutions.
- Private nonprofit colleges have a median graduation rate of 70%, compared to 38% for public colleges and 41% for private for-profit institutions.
- Ten years after entry, former students of private nonprofit colleges earn a median of $69,656, compared to $49,461 for public college graduates.
- Dependent undergraduate students face a strict federal borrowing limit of $27,000 in Direct Loans over a standard four-year enrollment period.
- Starting July 1, 2026, federal Parent PLUS loans are capped at $20,000 per year and $65,000 in total per dependent student.
What is the IPEDS Database and Where Does the Data Come From
The Mandatory Federal Reporting System for Higher Education
The Integrated Postsecondary Education Data System (IPEDS) is the core database maintained by the National Center for Education Statistics (NCES). Any college, university, or technical school that participates in federal student financial aid programs under Title IV of the Higher Education Act of 1965 must report its institutional data annually. This reporting is not voluntary. If an institution fails to submit its required surveys, the U.S. Department of Education can fine the school or revoke its eligibility to accept federal student loans and Pell Grants.
Families can use this federal repository to bypass marketing brochures and view audited, standardized metrics. When researching options, you can consult comprehensive college guides to understand how these institutional metrics shape the admissions landscape. Because the federal government mandates these disclosures, the database provides a level playing field for comparing student enrollment, retention rates, and instructional expenditures across thousands of campuses.
How Colleges Submit and Verify Their Annual Surveys
Colleges submit data through a series of interrelated survey components throughout the academic year. The process begins with the Institutional Characteristics component, which establishes the school's basic profile, calendar system, and tuition rates. During the winter and spring reporting cycles, institutional research offices must upload precise figures for student enrollment, graduation rates, financial aid allocations, and human resources.
Each institution appoints an IPEDS keyholder who is legally responsible for the accuracy of the submissions. The NCES system runs automated data-quality checks to flag anomalies, such as a sudden 10% drop in retention or an unexplained spike in administrative costs. Before the data is published, the college's chief administrator must personally review and lock the submission. Families can verify these figures themselves by asking a college's admissions office for its latest "IPEDS Data Feedback Report," a standardized document that compares the school's performance directly against a peer group of similar institutions.
The Difference Between IPEDS and the College Scorecard
While both tools originate from the U.S. Department of Education, they serve different analytical purposes. IPEDS is an institution-level database designed for researchers, policy makers, and administrators. It tracks cohorts of students based on institutional reporting, which historically focused primarily on first-time, full-time undergraduate students.
The College Scorecard pulls a significant portion of its data from IPEDS but combines it with federal administrative databases. Specifically, the Scorecard links institutional records with the National Student Loan Data System (NSLDS) and federal tax return data from the Internal Revenue Service. This integration allows the Scorecard to report median post-college earnings and cumulative student loan debt for individuals who received federal financial aid. When evaluating a school, families should use IPEDS to analyze institutional spending, overall graduation rates, and faculty salaries, while relying on the College Scorecard to examine program-specific debt and earnings.
Comparing Institutional Sectors and Control Types
Public versus Private Nonprofit Structural Differences
The Integrated Postsecondary Education Data System (IPEDS) groups institutions by control type. This classification dictates how schools fund their operations and aid packages. Public universities rely on state appropriations to subsidize tuition for local residents. According to CollegesRef data, public colleges have a median in-state tuition of $6,034, which is significantly lower than the median out-of-state tuition of $12,715.
Private nonprofit colleges operate on tuition revenue, endowment payouts, and private donations. While their median sticker price is high, their financial aid budgets can be substantial. Families should look at the table below to see how these structural differences impact actual costs. The median average net price for private nonprofit colleges is $27,167, compared to $10,437 for public institutions. However, private nonprofits show a median graduation rate of 70%, which is much higher than the public college median of 38%. When researching a private nonprofit like The Pennsylvania State University-Main Campus, which actually operates as a state-related public institution with a 72% graduation rate, families must check the specific institutional characteristics on the IPEDS "Institutional Identification" screen to confirm how the school is classified.
Colleges in this article

The Pennsylvania State University-Main Campus
University Park, PA
- Admit rate
- 92%
- Net price
- $24,012
- Grad rate
- 72%

Arizona State University Campus Immersion
Tempe, AZ
- Admit rate
- 90%
- Net price
- $14,694
- Grad rate
- 67%

Texas A & M University-College Station
College Station, TX
- Admit rate
- 57%
- Net price
- $21,527
- Grad rate
- 85%
Federal IPEDS and College Scorecard data on CollegesRef. Net price is the average paid after grants by first-time, full-time students who receive aid.
The Cost and Outcome Profile of For-Profit Institutions
Private for-profit colleges operate as businesses answerable to shareholders or owners. IPEDS data reveals a distinct financial and outcome profile for this sector. As shown in the table below, the median average net price for private for-profit colleges is $30,181. This is the highest net price of any sector, yet the median earnings 10 years after entry stand at $47,524, which is the lowest among the three groups.
The median graduation rate for these for-profit institutions is 41%. Families evaluating a for-profit program should ask the admissions office for the school's official "Gainful Employment" disclosure template. This federal document details the typical debt-to-earnings ratio for graduates of that specific program. You can calculate your own projected debt-to-income ratio by dividing the estimated annual loan payment by the median starting salary listed on the disclosure.
Using Carnegie Classifications for Apples-to-Apples Comparisons
Comparing a local baccalaureate college to a massive national research university skewers your analysis. To prevent this, use the Carnegie Classification system found within the IPEDS "Directory Information" menu. This system groups institutions by the level of degrees they award and their level of research activity.
When you search the IPEDS database, filter your results by "Carnegie Classification 2021: Basic". Select "Doctoral Universities: Very High Research Activity" if you want to compare large research institutions. Select "Baccalaureate Colleges: Arts & Sciences Focus" if you are looking at traditional four-year liberal arts colleges. This filter ensures you compare graduation rates and median earnings against peer institutions rather than the national average. If a baccalaureate college has a graduation rate below the 70% median for private nonprofits, or if its net price is far above the $27,167 median, families should ask the financial aid office for a detailed breakdown of their institutional merit aid criteria.
| Sector | Colleges | Median net price | Median in-state tuition | Median out-of-state tuition | Median graduation rate | Median earnings (10 yrs) |
|---|---|---|---|---|---|---|
| Public | 1,041 | $10,437 | $6,034 | $12,715 | 38% | $49,461 |
| Private nonprofit | 323 | $27,167 | $48,723 | $48,702 | 70% | $69,656 |
| Private for-profit | 44 | $30,181 | $18,367 | $18,367 | 41% | $47,524 |
Source: CollegesRef analysis of IPEDS and College Scorecard data for 1,408 published U.S. colleges with at least 2,000 students (latest data year 2025). Net price is the average paid by first-time, full-time students who receive grant aid.
At a glance
Graduation rate for the colleges in this list
Evaluating the Real Cost of Attendance and Net Price
Sticker Price versus Average Net Price After Grants
Published tuition rates rarely reflect what a family actually pays. To find the true cost, families must look at the average net price after subtracting all federal, state, and institutional grant aid. CollegesRef data shows that across all 1,408 published U.S. colleges with at least 2,000 students, the median average net price after grants is $13,737.
This net figure varies dramatically by the control type of the institution. For public colleges, the median in-state tuition is $6,034 and the median out-of-state tuition is $12,715, resulting in a median average net price of $10,437. Private nonprofit colleges show a median in-state tuition of $48,723, but their median average net price is $27,167 due to significant institutional discounting. Private for-profit colleges have a median in-state tuition of $18,367, yet they yield a higher median average net price of $30,181 because they offer fewer institutional grants.
To calculate a personalized estimate, locate the "Total Cost of Attendance" line on a college financial aid portal and subtract the total amount of non-repayable grants and scholarships. Do not subtract student loans or work-study offers from this total, as these items do not reduce the actual price of the degree.
Tracking Pell Grant Share to Assess Socioeconomic Diversity
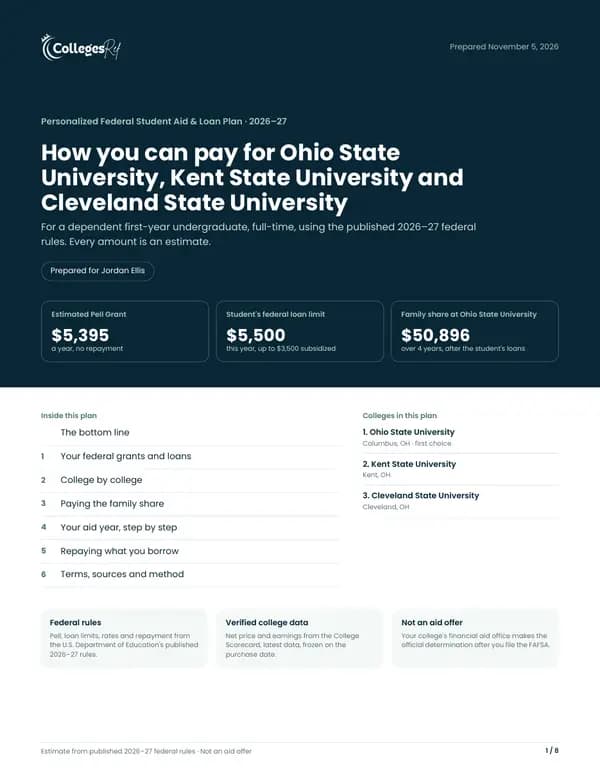
The proportion of undergraduates receiving federal Pell Grants serves as a reliable proxy for socioeconomic diversity on campus. According to studentaid.gov, the maximum Federal Pell Grant for the 2026-27 award year is $7,395, which is reserved for students with significant financial need.
CollegesRef data indicates that the median share of undergraduates receiving Pell Grants across all analyzed institutions is 34%. When researching a school like Arizona State University Campus Immersion or other large public universities, comparing their Pell recipient percentage against this national median reveals how effectively the institution enrolls and supports lower-income students. A exceptionally low Pell percentage often points to a student body dominated by high-income families, whereas a high percentage indicates a strong institutional commitment to access.
How to Find Net Price Disclosures on College Financial Aid Websites
Every institution participating in federal student aid programs must host a Net Price Calculator on its website. To find this tool, search the college name alongside the phrase "net price calculator" or navigate directly to the office of financial aid web page.
Before using the tool, gather the most recent federal tax returns, W-2 forms, and statements of net worth for the household. The calculator will ask for the student's academic profile and parental income to estimate both merit-based and need-based aid.
If the calculator results seem unclear, contact the financial aid office directly. Ask the representative if the estimated institutional grants are guaranteed for all four years, or if they require the student to maintain a specific cumulative grade point average to renew the award.
Analyzing Student Progress and Graduation Rates
Understanding the Normal Time Graduation Metric
The Integrated Postsecondary Education Data System (IPEDS) tracks graduation rates based on "normal time" to completion. For a bachelor's degree, normal time is four years, but the federal standard reporting metric focuses on a window of six years, which represents one and a half times the normal duration. When looking at a college's published graduation rate, families are usually seeing this six-year window.
Families should look at the IPEDS Graduation Rates (GR) survey component to find the distinction between the four-year, five-year, and six-year cohorts. A low four-year graduation rate combined with a high six-year rate often indicates that students struggle to register for required major courses or must work part-time to fund their education. To calculate the potential extra cost of a delayed graduation, multiply the school's net price by the additional semesters required. If a college has a low six-year completion rate, ask the admissions office for their average time-to-degree metric for your intended major.
Why Retention Rates Predict First-Year Student Success
First-to-second-year retention rates measure the percentage of first-time, degree-seeking undergraduates who return to the same institution the following fall. This metric serves as an early indicator of student satisfaction, academic support quality, and financial feasibility. IPEDS collects this data separately for full-time and part-time students.
According to CollegesRef data, the median graduation rate across all 1,408 published U.S. colleges with at least 2,000 students is 44%. Schools with retention rates well below this benchmark often have systemic issues, such as inadequate academic advising or hidden costs that force students to transfer after their first year. When evaluating a college, compare its first-year retention rate against the national median to see if the campus successfully supports its incoming class.
Comparing Graduation Outcomes at Large Public and Private Universities
Graduation rates vary significantly by institutional control and sector. CollegesRef data shows that private nonprofit colleges have a median graduation rate of 70%, whereas public colleges have a median graduation rate of 38%. Private for-profit colleges show a median graduation rate of 41%.
These broad sector medians do not tell the whole story for individual large campuses. For example, looking at some of the largest institutions in the country reveals wide variations in student outcomes. The graduation rate at Texas A & M University-College Station is 85%, and The Pennsylvania State University-Main Campus has a graduation rate of 72%. Both of these public flagship institutions perform well above the public sector median.
In contrast, Arizona State University Campus Immersion has a graduation rate of 67%, while Grand Canyon University, a large private institution, has a graduation rate of 54%. Southern New Hampshire University shows a graduation rate of 42%, and the University of Phoenix-Arizona has a graduation rate of 21%. Families must use these IPEDS figures to look past marketing materials and evaluate whether a specific university actually delivers degrees to its enrolled student body.
Measuring Post-College Earnings and Financial Outcomes
How the Federal Government Tracks Earnings Ten Years After Entry
The U.S. Department of Education measures post-college earnings by matching student enrollment rosters with federal administrative tax records. This tracking begins the year a student first enrolls in college, rather than the year they graduate. The data includes any student who received federal financial aid, such as a Direct Loan or a Pell Grant.
Ten years after entry, the government calculates the median earnings of these former students who are working and not enrolled in graduate school. Because this metric includes students who dropped out, it reflects the broad financial risk of attending a specific institution. Families can find these figures on the College Scorecard or through CollegesRef institutional profiles.
Comparing Sector Median Earnings Against the National College Graduate Median
Earnings outcomes vary significantly by the type of institution a student attends. CollegesRef data shows that across all 1,408 published U.S. colleges with at least 2,000 students, the median earnings 10 years after entry sit at $52,768.
When you break this down by institutional control, clear patterns emerge:
- Private nonprofit colleges yield a median earnings figure of $69,656.
- Public colleges show a median earnings figure of $49,461.
- Private for-profit colleges result in a median earnings figure of $47,524.
Families can use these benchmarks to ground their expectations. For instance, looking at a public institution like Purdue University-Main Campus allows an applicant to compare its specific ten-year earnings data against both the national public college median of $49,461 and the overall median of $52,768.
Aligning Student Debt Limits with Expected Post-Graduation Salaries
A standard rule of thumb in financial aid planning is that a student should not borrow more for their undergraduate education than their expected first-year salary. Families can calculate their estimated debt-to-income ratio by comparing projected federal loan balances against the IPEDS and College Scorecard median earnings data.
To perform this calculation, add the maximum statutory federal student loan limits across four years of study. According to studentaid.gov, a dependent undergraduate can borrow a maximum of $27,000 in Direct Loans over four years.
To test the financial viability of a specific college, use this simple formula:
$$\text{Debt-to-Earnings Ratio} = \frac{\text{Total Projected Student Debt}}{\text{Median Earnings 10 Years After Entry}}$$
If a student plans to borrow the maximum dependent limit of $27,000, and the college has a median ten-year earnings figure of $54,000, the debt-to-earnings ratio is 50 percent. If the resulting ratio exceeds 100 percent, the debt load may prove difficult to manage on a standard ten-year repayment plan. In such cases, families should ask the financial aid office for a detailed breakdown of historical earnings by specific major, which is often available on the college's internal post-graduation employment surveys.
Navigating Federal Student Loan Limits and Borrowing Rules
Annual and Aggregate Direct Loan Limits for Dependent Undergraduates
Families planning for college costs must look beyond the institutional aid package to understand what a student can borrow under federal guidelines. The U.S. Department of Education restricts the amount of Direct Subsidized and Unsubsidized Loans an undergraduate can accept each year. For dependent students, the annual borrowing limit starts at $5,500 for the first year of study. This cap rises to $6,500 in the second year, and then to $7,500 per year for the third year and beyond.
Over a standard four-year enrollment period, a dependent undergraduate can borrow a maximum of $27,000. If a student takes longer to graduate, the absolute aggregate limit for dependent undergraduates is $31,000, of which no more than $23,000 may be in subsidized loans. These limits are set by federal law, as detailed on studentaid.gov.
To calculate your actual out-of-pocket gap, locate the "Estimated Financial Assistance" section on your college financial aid award letter. Subtract the maximum first-year federal loan of $5,500 from your net cost. If the remaining balance is high, you will need to identify other funding sources.
Borrowing Rules and Higher Caps for Independent Students
Students who meet the federal criteria for independent status, such as being at least 24 years old, married, or an active-duty military member, have access to higher borrowing limits. These elevated caps also apply to dependent students whose parents are denied a Parent PLUS loan due to adverse credit history.
According to studentaid.gov, independent undergraduates may borrow up to $9,500 in their first year. This annual limit increases to $10,500 in the second year, and reaches $12,500 per year in the third year and subsequent years. The lifetime aggregate limit for independent undergraduate borrowers is capped at $57,500.
When comparing options like the Indiana University-Bloomington Main Campus with other public institutions, families should ask the financial aid office how they package these additional unsubsidized loans for students who qualify for the independent limits.
Understanding Parent PLUS and Graduate Loan Limits
Federal borrowing rules undergo periodic adjustments that directly impact how families finance higher education. For loans first disbursed on or after July 1, 2026, Parent PLUS borrowing is capped at $20,000 per year and $65,000 in total per dependent student, according to studentaid.gov. This policy prevents parents from taking on unlimited debt to cover the rising costs of undergraduate education.
Furthermore, major structural changes apply to graduate-level borrowing. For new borrowers starting July 1, 2026, Grad PLUS loans are eliminated entirely. Graduate students may instead borrow up to $20,500 annually in Direct Unsubsidized Loans, with a lifetime aggregate limit of $100,000. Professional students, such as those in medical or law programs, face an annual limit of $50,000 and a lifetime aggregate cap of $200,000 under these updated federal rules.
Before signing any loan agreement, families should request a personalized College Financing Plan from the financial aid office to verify how these strict federal caps will affect their funding strategy over four years.
Three Real-World Scenarios of Families Comparing Colleges Using IPEDS
A first-generation student comparing two in-state offers
The household income and financial aid figures in this scenario are hypothetical. An applicant from Pennsylvania wants to stay in-state and is choosing between The Pennsylvania State University-Main Campus and a smaller public college. The student qualifies for the maximum Federal Pell Grant of $7,395, as detailed on https://studentaid.gov/understand-aid/types/grants/pell.
First, the family looks up the graduation rates to see which school has a better track record of helping students finish. CollegesRef data shows Penn State has a 72% graduation rate, while the smaller public college has a graduation rate of 38%, which is the median for public colleges in the database. Second, the family compares the net price. Penn State offers a net price of $22,000 after grants, while the smaller public college has a net price of $10,437, matching the median average net price for public institutions. Third, the student calculates the debt needed for each option.
The student decides to attend the smaller public college. While Penn State has a much higher graduation rate, the annual net price gap of more than $11,000 would force the student to find private loans. A dependent undergraduate can only borrow $5,500 in federal Direct Loans their first year, according to https://studentaid.gov/understand-aid/types/loans/subsidized-unsubsidized. The smaller public college allows the student to graduate with minimal debt.
A family evaluating a private nonprofit versus a public flagship
The household income and financial aid figures in this scenario are hypothetical. A family is comparing Arizona State University Campus Immersion with a private, nonprofit university. The student wants to study engineering and has received admission to both.
First, the family checks the graduation rates on CollegesRef. Arizona State University has a 67% graduation rate, while the private nonprofit has a 70% graduation rate, which is the median for private nonprofit colleges. Second, they look at the pricing. The private nonprofit has an in-state tuition of $48,723, which is close to the private nonprofit median of $48,723, and offers a net price of $27,167. Arizona State University has an out-of-state tuition of $12,715, which is the median for public colleges, and a net price of $14,000. Third, they compare the median earnings 10 years after entry. The private nonprofit median is $69,656, while public colleges have a median of $49,461.
The family chooses Arizona State University. The graduation rates are nearly identical, but the private college costs over $13,000 more per year. Over four years, this total price difference exceeds the $27,000 maximum a dependent student can borrow in federal Direct Loans, as documented on https://studentaid.gov/understand-aid/types/loans/subsidized-unsubsidized. The parent refuses to take out Parent PLUS loans to cover the gap.
An independent adult student choosing an online program
The household income and financial aid figures in this scenario are hypothetical. A 26-year-old independent student living in Texas wants to earn a bachelor's degree online while working. The student is choosing between Southern New Hampshire University and the University of Phoenix-Arizona.
First, the student accesses the CollegesRef database to compare the graduation rates of the two massive online providers. Southern New Hampshire University has a 42% graduation rate, while the University of Phoenix-Arizona has a 21% graduation rate. Second, the student checks the median earnings 10 years after entry. The student finds that private for-profit colleges have median earnings of $47,524, whereas private nonprofit colleges have median earnings of $69,656. Third, the student reviews the federal borrowing limits for independent undergraduates on https://studentaid.gov/understand-aid/types/loans/subsidized-unsubsidized, noting the first-year limit of $9,500.
The student selects Southern New Hampshire University. The 42% graduation rate is double the 21% rate of the competitor. Because the student is independent, they can access higher federal loan limits to cover the tuition without relying on private lenders.