
Healthcare practitioners
Pediatric Surgeons
- Median pay
- $559,030
- Outlook
- As fast as average
Doctoral or professional degree
Via Medicine
2,500+ community & trade schoolsNew: 2,500+ community colleges and trade schools added. By stateExplore by state
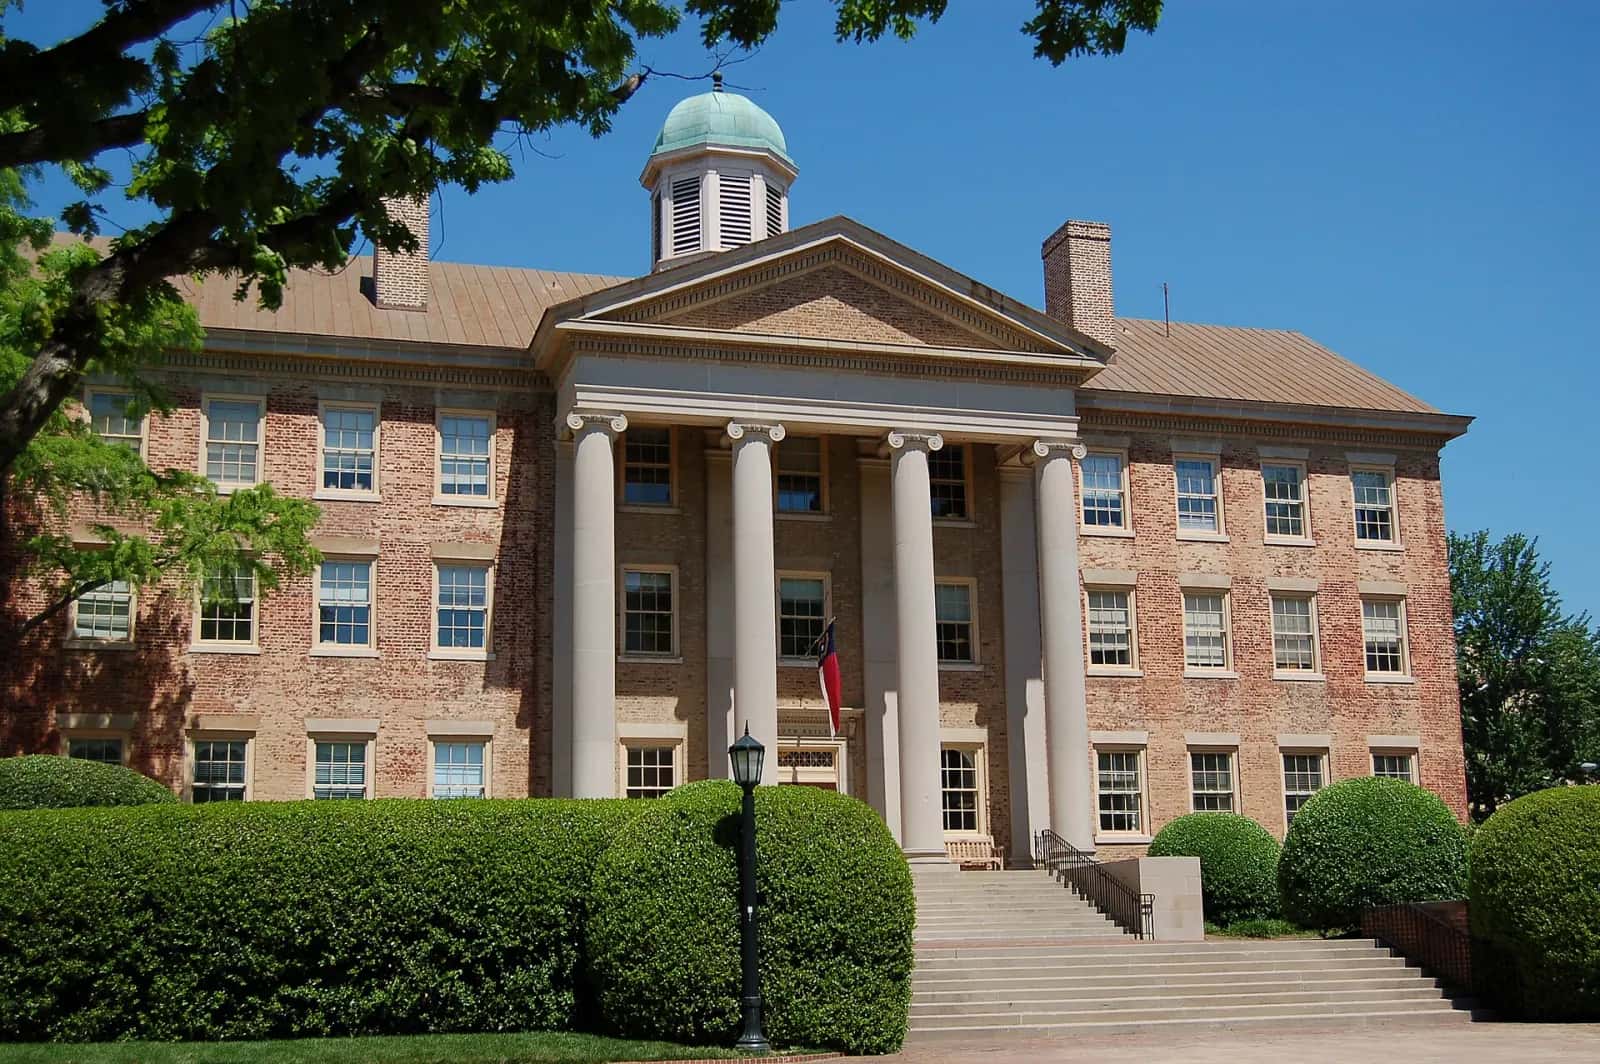
University of North Carolina at Chapel Hill Main Campus
Also known as UNC
Chapel Hill, NC, United States
Data verified Nov 2026 · CollegesRef 2026–27 edition
Photo: (User:Wgreaves), Public domain, via Wikimedia Commons
Graduation rate: 91.1% of first-time, full-time students finish within 150% of the normal time (CollegesRef 2026–27 edition). 96.6% return for a second year. Median earnings: $81,094 a year for former students who received federal aid, ten years after they started college.
Source: U.S. College Scorecard, latest data
University of North Carolina at Chapel Hill Main Campus has 84 programs with reported graduate earnings. The highest is Advanced/Graduate Dentistry and Oral Sciences (master's), where graduates earn a median $216,728 four years after finishing, against $204,501 for the same field nationally.
Federal data from IPEDS and the U.S. College Scorecard, not student reviews.
Graduation rate
First-time, full-time students finishing within 150% of normal time
First-year retention
Students who return for a second year
Transfer-out rate
First-time, full-time students who transferred to another college
Median earnings
$81,094
Former students who received federal aid
What University of North Carolina at Chapel Hill Main Campus graduates earn against what they borrow and what the degree costs after grants.
| Latest official data | UNC | Similar colleges |
|---|---|---|
| Median earningsFormer students, 10 years after startingSource: U.S. College Scorecard, latest data | $81,094 | $52,980 |
| Typical federal debtGraduates who borrowed; about $137 a month on a 10-year planSource: U.S. College Scorecard, latest data | $12,086 | $20,500 |
| Years to pay back4 years of average net price ($11,305 a year), paid with 10% of median earningsSource: U.S. College Scorecard, latest data | 5.6 years | 10.5 years |
Similar colleges: the median of 16 public four-year colleges in North Carolina with the same figures reported. Payback is illustrative: it ignores interest, taxes and living costs, and earnings vary by major. Check a loan payment against earnings.
Source: U.S. College Scorecard, field of study, latest data
Median earnings of graduates who received federal aid, one and four years after finishing, and the median federal loan debt they borrowed at University of North Carolina at Chapel Hill Main Campus. The field median is the middle value for the same field and credential across every college that reports it. 124 more programs have too few graduates for earnings to be published.
Highest-earning programs
| Program | Graduates | Earnings 1 yr | Earnings 4 yr | Field median | Median debt |
|---|---|---|---|---|---|
| Computer Science | 404 | $94,151 | $137,047 | $99,57438% above | $11,958 |
| Business Administration, Management and Operations | 418 | $88,182 | $135,874 | $64,798110% above | $9,250 |
| Applied Mathematics | 206 | $81,296 | $119,839 | $92,80329% above | N/A |
| Health and Medical Administrative Services | 47 | $44,456 | $110,204 | $58,97987% above | N/A |
| Economics | 470 | $69,762 | $103,846 | $79,46831% above | $13,000 |
| Physics | 35 | $66,284 | $103,477 | $78,56932% above | $14,067 |
| Mathematics | 139 | $64,598 | $101,599 | $70,44344% above | $13,000 |
| Information Science/Studies | 105 | $78,821 | $100,940 | $82,54022% above | $9,000 |
| Biomedical/Medical Engineering | 148 | $76,315 | $97,992 | $94,1034% above | $18,976 |
| Peace Studies and Conflict Resolution | 96 | $46,230 | $80,344 | $68,77017% above | $8,282 |
| Registered Nursing, Nursing Administration, Nursing Research and Clinical Nursing | 215 | $76,947 | $78,585 | $86,83810% below | $17,275 |
| Statistics | 0 | $77,181 | N/A | $67,60214% above | $11,500 |
| Human Resources Management and Services | 115 | $54,488 | $76,811 | $67,49614% above | $14,000 |
| Public Policy Analysis | 159 | $52,170 | $74,403 | $69,6567% above | $12,300 |
| Clinical/Medical Laboratory Science/Research and Allied Professions | 16 | N/A | $72,892 | $74,8143% below | N/A |
| Dental Support Services and Allied Professions | 28 | $67,596 | $72,567 | $68,5836% above | $9,001 |
| Liberal Arts and Sciences, General Studies and Humanities | 22 | $62,893 | $72,422 | $52,57438% above | N/A |
| Political Science and Government | 401 | $46,926 | $72,001 | $61,93516% above | $10,800 |
| Philosophy | 45 | $43,620 | $70,709 | $56,84924% above | $10,100 |
| Communication and Media Studies | 534 | $49,277 | $70,240 | $54,18430% above | $12,500 |
| Allied Health Diagnostic, Intervention, and Treatment Professions | 11 | $70,039 | N/A | $69,8600% above | N/A |
| Area Studies | 164 | $38,868 | $65,933 | $57,20815% above | $13,230 |
| Natural Resources Conservation and Research | 147 | $42,850 | $65,337 | $55,04419% above | $10,134 |
| Chemistry | 100 | $39,779 | $64,981 | $66,3662% below | $11,681 |
| Romance Languages, Literatures, and Linguistics | 58 | $33,205 | $64,570 | $56,12215% above | $13,459 |
| Sports, Kinesiology, and Physical Education/Fitness | 382 | $38,759 | $63,286 | $53,39119% above | $13,000 |
| Biology, General | 613 | $36,437 | $62,047 | $57,9207% above | $13,500 |
| Music | 44 | N/A | $58,127 | $43,38834% above | $13,653 |
| History | 126 | $38,229 | $57,952 | $50,62014% above | $11,117 |
| Anthropology | 131 | $37,453 | $56,589 | $46,12123% above | $11,762 |
| Ethnic, Cultural Minority, Gender, and Group Studies | 28 | $39,634 | $54,691 | $51,5656% above | N/A |
| Linguistic, Comparative, and Related Language Studies and Services | 39 | $45,584 | $54,181 | $50,9266% above | $10,000 |
| Religion/Religious Studies | 20 | N/A | $52,716 | $47,79110% above | N/A |
| Sociology | 94 | $43,771 | $51,801 | $52,1161% below | $13,300 |
| English Language and Literature, General | 176 | $37,505 | $51,208 | $48,9485% above | $8,104 |
| Geography and Cartography | 32 | N/A | $49,476 | $57,82514% below | N/A |
| Teacher Education and Professional Development, Specific Levels and Methods | 115 | $33,806 | $49,209 | $47,9333% above | $9,694 |
| Fine and Studio Arts | 41 | $32,773 | $41,722 | $41,5490% above | $15,325 |
| Drama/Theatre Arts and Stagecraft | 29 | $32,384 | $41,362 | $40,0733% above | N/A |
| Neurobiology and Neurosciences | 190 | $39,200 | N/A | $37,9163% above | $13,096 |
| Behavioral Sciences | 524 | $38,662 | N/A | $38,6620% above | $12,000 |
| Program | Graduates | Earnings 1 yr | Earnings 4 yr | Field median | Median debt |
|---|---|---|---|---|---|
| Advanced/Graduate Dentistry and Oral Sciences | 22 | $207,416 | $216,728 | $204,5016% above | $120,087 |
| Medical Clinical Sciences/Graduate Medical Studies | 8 | N/A | $204,372 | $194,3215% above | N/A |
| Business Administration, Management and Operations | 7 | $186,447 | $203,447 | $94,858114% above | N/A |
| Pharmacy, Pharmaceutical Sciences, and Administration | 28 | $145,567 | $170,529 | $142,51220% above | N/A |
| Management Sciences and Quantitative Methods | 954 | $158,240 | N/A | $92,30071% above | $98,931 |
| Allied Health Diagnostic, Intervention, and Treatment Professions | 23 | $111,986 | $122,874 | $126,6673% below | $127,227 |
| Registered Nursing, Nursing Administration, Nursing Research and Clinical Nursing | 48 | $98,276 | $114,707 | $120,2875% below | $41,000 |
| Health and Medical Administrative Services | 83 | $86,773 | $113,370 | $89,96826% above | $77,550 |
| Accounting and Related Services | Not available | $78,997 | $110,766 | $93,34819% above | $69,500 |
| Medical Illustration and Informatics | 40 | $105,918 | N/A | $88,85019% above | $44,994 |
| Communication and Media Studies | 18 | $68,161 | $88,174 | $68,40429% above | $49,937 |
| Public Health | 472 | $65,768 | $86,115 | $79,5098% above | $70,878 |
| City/Urban, Community, and Regional Planning | 44 | $73,951 | $82,613 | $81,3632% above | $40,864 |
| Public Administration | 52 | $73,925 | $81,915 | $77,5026% above | $47,625 |
| Information Science/Studies | 81 | $82,624 | $81,473 | $105,08822% below | $41,000 |
| Educational Administration and Supervision | 24 | $76,299 | $76,137 | $69,9449% above | $39,838 |
| Sports, Kinesiology, and Physical Education/Fitness | 32 | $57,545 | $71,951 | $60,55319% above | N/A |
| Communication Disorders Sciences and Services | 28 | $59,649 | $71,783 | $66,3108% above | $41,000 |
| Political Science and Government | 18 | $70,095 | N/A | $59,65917% above | N/A |
| Nutrition Sciences | 3 | $51,392 | $65,013 | $69,1666% below | N/A |
| Rehabilitation and Therapeutic Professions | 42 | $56,593 | $64,051 | $71,12110% below | $41,000 |
| Social Work | 135 | $54,815 | $62,611 | $62,6190% above | $47,743 |
| Library Science and Administration | 77 | $51,179 | $57,675 | $55,9463% above | $56,600 |
| Student Counseling and Personnel Services | 16 | $54,494 | $56,624 | $58,9764% below | $48,391 |
| Teacher Education and Professional Development, Specific Levels and Methods | 43 | $49,237 | $54,867 | $58,8467% below | $19,250 |
| Education, General | 7 | N/A | $54,337 | $63,85215% below | N/A |
| Fine and Studio Arts | 8 | N/A | $51,978 | $48,7637% above | N/A |
| Program | Graduates | Earnings 1 yr | Earnings 4 yr | Field median | Median debt |
|---|---|---|---|---|---|
| Health and Medical Administrative Services | 28 | $152,130 | $144,922 | $117,50423% above | N/A |
| Pharmacy, Pharmaceutical Sciences, and Administration | 22 | $139,657 | N/A | $101,76637% above | N/A |
| Biomathematics, Bioinformatics, and Computational Biology | 37 | $136,705 | N/A | $136,7050% above | N/A |
| Chemistry | 42 | $111,234 | $114,619 | $116,1221% below | N/A |
| Ecology, Evolution, Systematics, and Population Biology | 21 | $86,726 | $113,327 | $93,83121% above | N/A |
| Genetics | 7 | N/A | $101,128 | $108,6297% below | N/A |
| Education, General | 8 | N/A | $91,430 | $95,5434% below | N/A |
| Behavioral Sciences | 24 | $70,077 | N/A | $70,0770% above | N/A |
| Program | Graduates | Earnings 1 yr | Earnings 4 yr | Field median | Median debt |
|---|---|---|---|---|---|
| Dentistry | 91 | $139,945 | $198,570 | $180,63310% above | $224,422 |
| Law | 208 | $93,372 | $142,928 | $101,09141% above | $86,403 |
| Registered Nursing, Nursing Administration, Nursing Research and Clinical Nursing | 35 | $114,631 | $142,610 | $133,6447% above | $58,500 |
| Pharmacy, Pharmaceutical Sciences, and Administration | 119 | $76,088 | $135,678 | $136,7151% below | $158,705 |
| Medicine | 176 | $64,208 | $106,964 | $106,2801% above | $157,242 |
| Communication Disorders Sciences and Services | 10 | $80,020 | $87,889 | $89,1931% below | N/A |
| Rehabilitation and Therapeutic Professions | 29 | $71,981 | $73,711 | $81,3209% below | $66,500 |
| Program | Graduates | Earnings 1 yr | Earnings 4 yr | Field median | Median debt |
|---|---|---|---|---|---|
| Public Health | Not available | $94,895 | $77,776 | $77,6050% above | N/A |
Careers linked to the programs University of North Carolina at Chapel Hill Main Campus reports, highest national median pay first. Pay and outlook are BLS figures for the whole occupation, not for this college's graduates.
Healthcare practitioners
Doctoral or professional degree
Via Medicine
Healthcare practitioners
Doctoral or professional degree
Via Medicine
Healthcare practitioners
Doctoral or professional degree
Via Medicine
Healthcare practitioners
Doctoral or professional degree
Via Medicine
Healthcare practitioners
Doctoral or professional degree
Via Medicine
Healthcare practitioners
Doctoral or professional degree
Via Medicine
Verified facts
Free tools
 Duke UniversityDurham, NC
 Wake Forest UniversityWinston-Salem, NC
 University of Virginia-Main Campus UVACharlottesville, VA
 North Carolina State University at RaleighRaleigh, NC
 The University of Tennessee-Knoxville Main CampusKnoxville, TN
Premium Fit Report$29 once
Your college list and campus fit turned into up to 10 best-fit colleges, with reach, target and likely groups, costs, earnings and an action plan.
Build your free college list See a sample reportSimilar colleges
Bars show profile closeness out of 100: how near each college's graduation rate, size, admit rate, net price, Carnegie class, and control are to University of North Carolina at Chapel Hill Main Campus. The order also uses CollegesRef matching tiers, so a later card can score higher.
Duke University
Durham, NC
Graduation rate 96%, close to 91%
Profile closeness62/100
Wake Forest University
Winston-Salem, NC
Graduation rate 90%, close to 91%
Profile closeness59/100
University of Virginia-Main Campus UVA
Charlottesville, VA
Graduation rate 94%, close to 91%
Profile closeness88/100
North Carolina State University at Raleigh
Raleigh, NC
Graduation rate 85%, close to 91%
Profile closeness79/100
The University of Tennessee-Knoxville Main Campus
Knoxville, TN
Enrollment 30,418 students, close to 20,752
Profile closeness68/100

Virginia Polytechnic Institute and State University
Blacksburg, VA
Graduation rate 86%, close to 91%
Profile closeness65/100

University of Michigan-Ann Arbor Main Campus
Ann Arbor, MI
Graduation rate 93%, close to 91%
Profile closeness89/100

University of California-Los Angeles UCLA
Los Angeles, CA
Graduation rate 93%, close to 91%
Profile closeness88/100
Save it to your Backpack and compare it with the other schools you are considering.
Add colleges to your Backpack as you research.
Line up cost, admit rate, and outcomes side by side.
Email your Backpack to a parent or counselor.